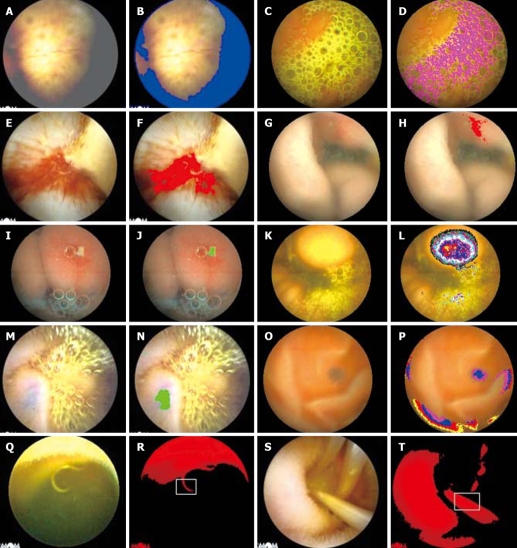
Figure 1.
The screened results of enteric lesions by the IPS. A: Space-occupying lesions; B: The blue area in the image for the “dark region”; C: The enteric bile; D: The purple area in the image for the enteric bile; E: The enteric blood (bleeding); F: The red area in the image for the enteric blood; G: Esoenteritis; H: The red area in the image for esoenteritis; I: Mucosal ulcer; J: The green area in the image for mucosal ulcer; K: Space-occupying lesions; L: Different coloring circle in the image for space-occupying lesions; M: Venous angioma in the bright background; N: The green area in the image for venous angioma; O: Venous angioma in the dark background; P: The loop-closed distribution of Gv of the venous angiomain image; Q: Parasites (hook worms); R: The image of red components (Rv > 150) and the curvature of the double limits in the pane calculated; S: Parasites (ascarides); T: The image of red components (Rv > 150) and the linearity of the double limits in the pane calculated.

