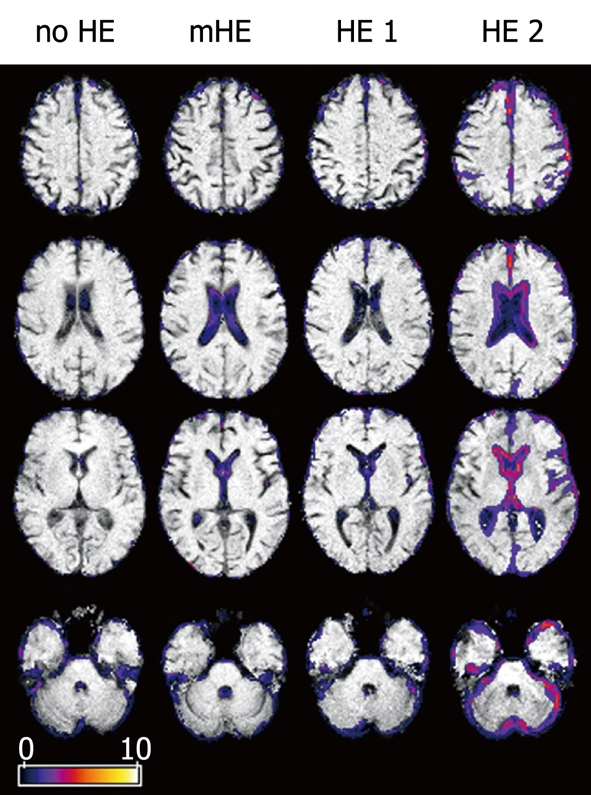
Figure 3.

(Pseudo-)t-maps. Binary data of patients with no HE, mHE, HE 1 and HE 2 compared to controls. Axial views superimposed on the binary images of representative subjects showing differences in brain size. Colored areas represent voxels with significant differences. CSF space was increased in lateral cerebral fissure; parietal, frontal and cerebellar gyration were prominent in overt HE.
