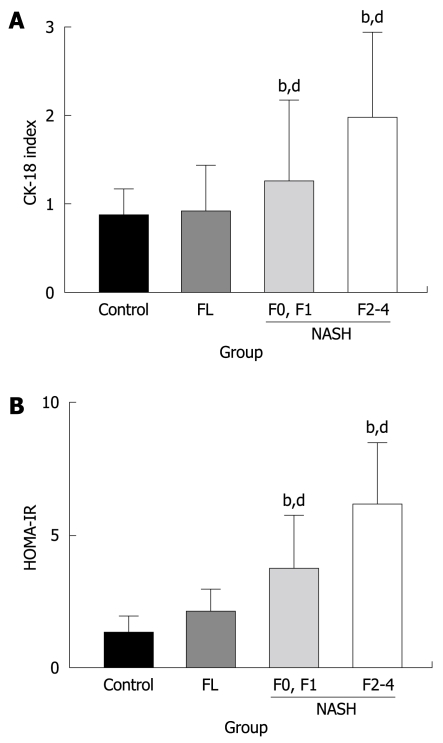
Figure 3.
Semi-quantitative analysis of the CK-18-positive cells in the liver (A) and HOMA-IR (B) in NAFLD. Similar to the CD34-positive neovascularization, there was no difference between the control healthy liver and FL. In NASH, a marked augmentation of CK-18 (A) and HOMA-IR (B) was found in the liver of NASH as compared with FL. The magnitude of neovascularization in high-grade (F2 to F4) liver fibrosis was more than in low-grade (F0, F1) fibrosis. The number of patients in each group was as follows; C (n = 3), FL (n = 11), low-grade fibrosis (F0 and F1: n = 10), and high-grade fibrosis (F2 to F4: n = 18). bP < 0.01 vs control group; dP < 0.01 vs low-grade fibrosis with NASH group.

