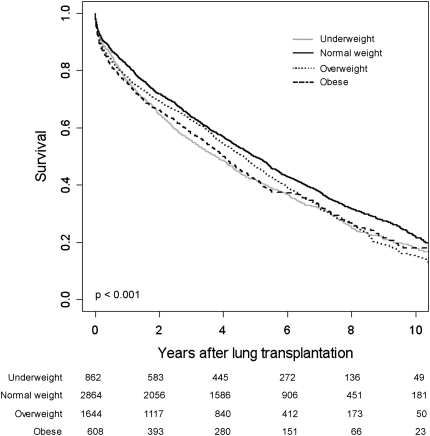
Figure 2.
Multivariable-adjusted survival curves for underweight, normal weight, overweight, and obese lung transplant recipients. Survival estimates are adjusted for the covariates in model 4 listed in the footnote to Table 2. Bottom: Numbers indicate the number of surviving lung transplant recipients at each time point.

