
Figure 6.
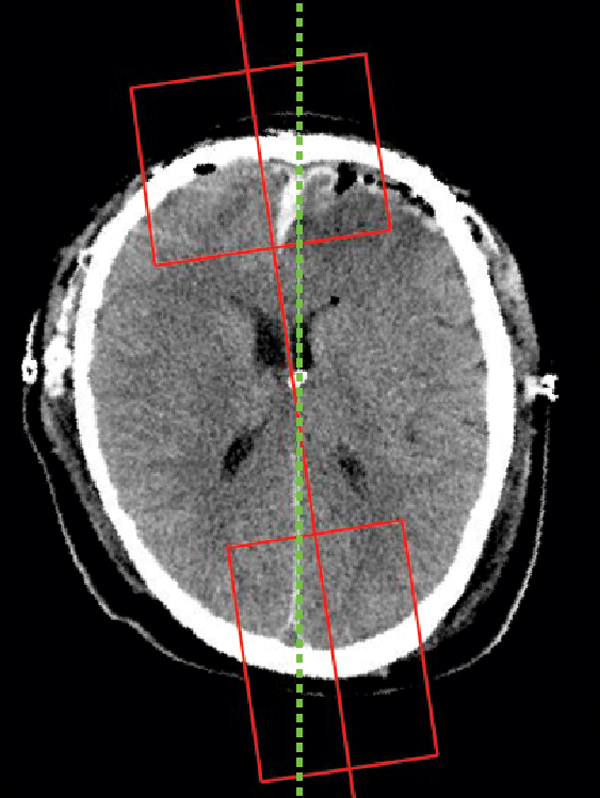
Example midline detection result. The green line is the final ideal midline detection result. The red line is the approximate line detected based on symmetry. Two red boxes are used to get the Region of Interest for protrusion and falx cerebri detection.