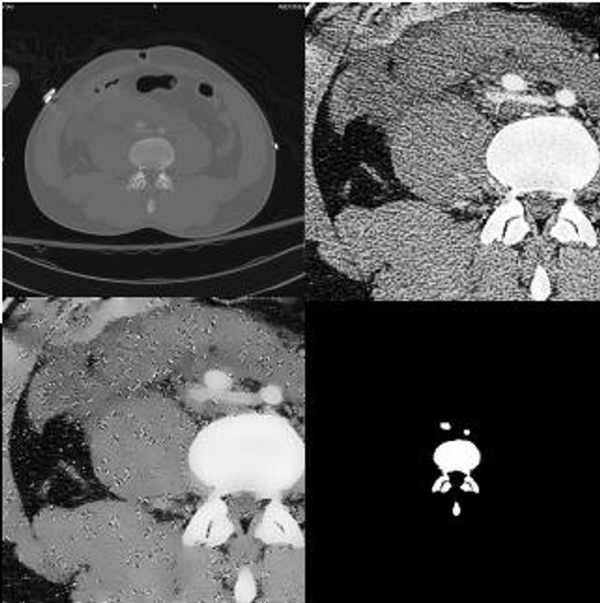
Figure 2.

Sample Result. The original image is in the upper left corner. The image in the upper right corner is the image after cropping it to the region in which bone is found and histogram equalization. In the lower left corner is the image after Speckle Reducing Anisotropic Diffusion (SRAD) filtering. In the lower right corner are results of segmentation. It can be noticed that the detected bone contour and shape are true to the actual bone contour and size. The separation between bones is maintained even when neighboring bones very close to one another.
