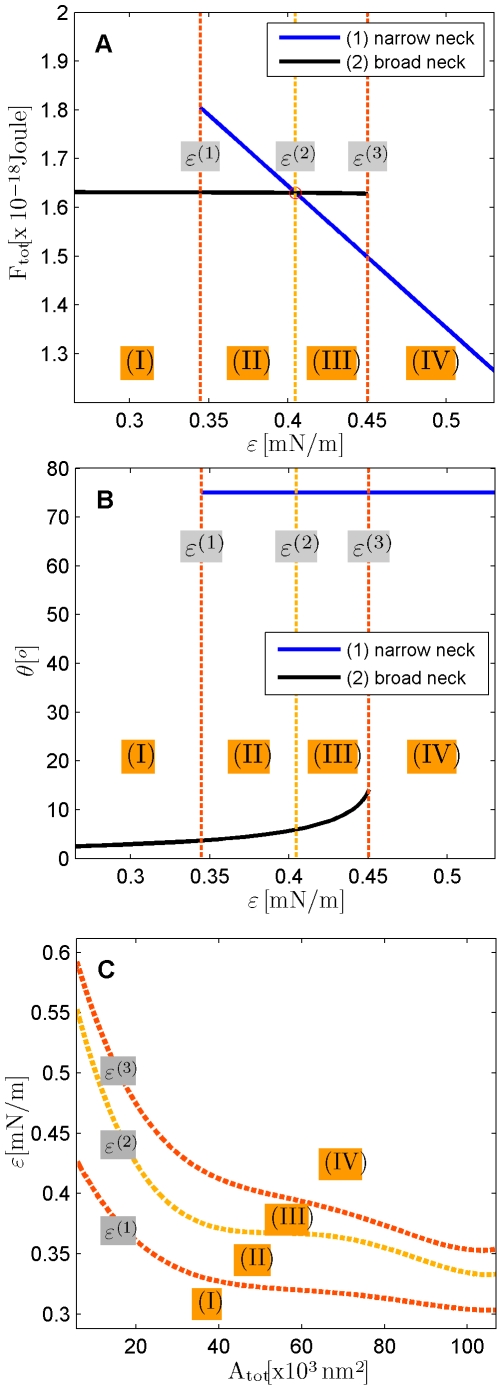
Figure 5. Phase diagrams describing different regimes of the system configurations in the fore-fission state.
The phase boundaries are determined by the characteristic values of the membrane affinity to the protein dome surface,  ,
,  , and
, and  . (A) The total energies of the narrow- and broad- neck configurations are represented by the lines 1 and 2, respectively. (B) The attachment angles in the narrow and broad neck configurations are represented by the lines 1 and 2, respectively,
  (C) The characteristic affinities depending on the total membrane area
  . The phase diagrams are divided into four regions corresponding to different regimes of the possible configurations of the system: (I) only broad neck; (II) stable broad neck and quasi-stable narrow neck; (III) stable narrow neck and quasi-stable broad neck; (IV) only narrow neck.

