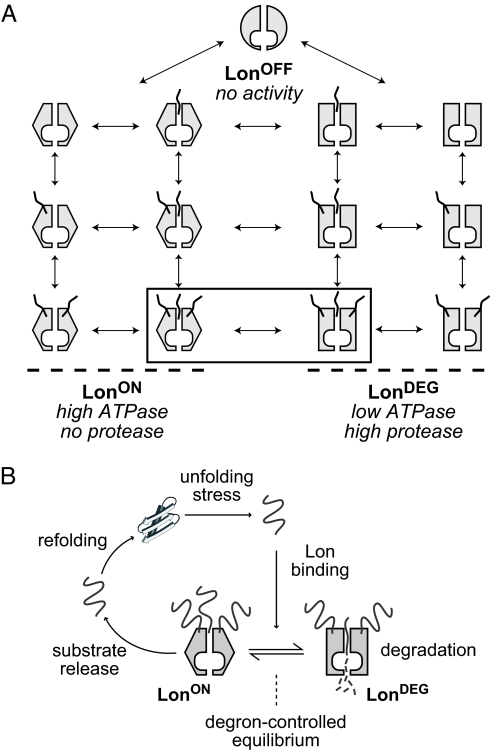
Fig. 4.
Models for allosteric control of Lon. (A) Model showing equilibrium states of a system with three Lon conformations: LonOFF, LonON, and LonDEG (depicted by different shapes). Degrons are shown as squiggly lines. One degron-binding site in the axial pore of Lon and two flanking allosteric binding sites are depicted. At substrate saturation, the relative affinity of the degron for LonON versus LonDEG determines the equilibrium distribution of the two fully liganded species shown in the rectangle. (B) Model in which an unfolded protein binds Lon and then partitions between a degradation pathway mediated by LonDEG or a refolding pathway mediated by LonON and possibly other cellular chaperones. The substrate degron determines the equilibrium distribution of the two forms of Lon and thus determines which pathway is favored.

