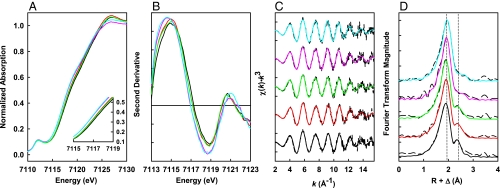
Fig. 2.
Overlay of the Fe K-edge XAS absorption spectra (A), the second derivatives (B), the Fe K-edge EXAFS (C), and the nonphase shifted Fourier transforms (D) of ΔnifH MoFe protein during P-cluster maturation. The ΔnifH MoFe protein was matured by incubation with excess MgATP, Fe protein (molar ratio of Fe protein/ΔnifH MoFe protein = 2:1) and dithionite (20 mM) for 0 (black), 5 (red), 20 (green), 60 (pink), and 120 (cyan) min. The change in the rising edge at 7,117 ev (A) corresponds to a reduction of cluster Fe atoms, and the most significant shifts in Fe K-edge energy are between 0–5 and 20–60 min (B). The change in the EXAFS spectra (C) is reflected by the change in the Fe-Fe scattering peak at ≈2.4 Å and by the shift in the Fe-S scattering peak at ≈1.8 Å in the Fourier transforms (D), indicating a structural rearrangement upon P-cluster maturation. The Fourier transforms of the ΔnifH MoFe protein matured beyond 60 min (D, pink and cyan) closely resemble that of the ΔnifB MoFe protein (8).

