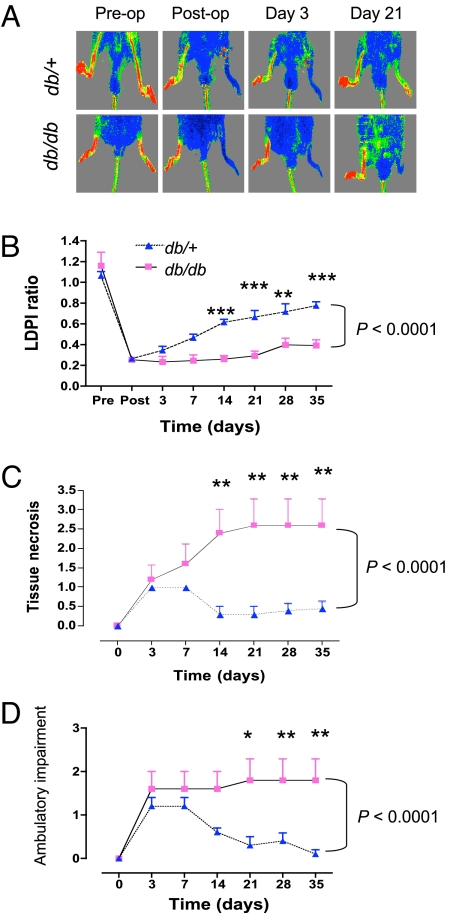
Fig. 1.
Effect of diabetes on recovery after femoral artery ligation. (A) Representative laser Doppler perfusion imaging (LDPI) of diabetic (db/db) and nondiabetic (db/+) mice immediately pre- and postligation and then 3 and 21 days later. The red-to-blue spectrum represents the range of blood flow from highest to lowest, respectively. (B) LDPI was performed at the indicated times after femoral artery ligation and the ratio of perfusion in the ischemic:nonischemic limb was determined. (C and D) Tissue necrosis (C) and ambulatory impairment (D) were scored at each time point using criteria described in Materials and Methods. Data in (B–D) are mean ± SEM (n = 4–5 mice each). Differences between the two groups were assessed by two-way ANOVA with Bonferroni correction (brackets at right); *, P < 0.05, **, P < 0.01, and ***, P < 0.001 for comparison between groups at individual time points.

