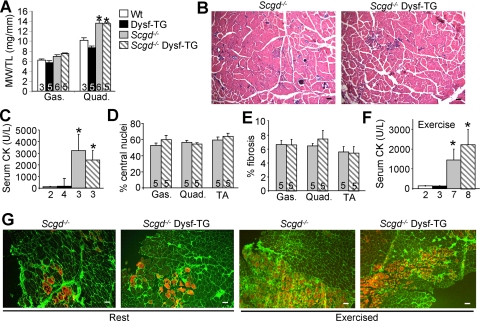
Figure 3.
Scgd−/− mice do not show improvement with dysferlin transgenesis. A: Muscle weight to tibia length ratios of gastrocnemius and quadriceps at 6 months of age. *P < 0.05 versus wild-type (Wt). B: Representative H&E-stained quadriceps histological sections from 6-month-old Scgd−/− and Scgd−/− Dysf-TG. Scale bars = 100 μm. C: Serum CK levels in 6-month-old mice. *P < 0.05 versus wild-type. D: Percentage of fibers containing central nuclei in the gastrocnemius, quadriceps, and TA from Scgd−/− and Scgd−/− Dysf-TG mice. E: Percent fibrosis in the same groups of mice as in D. F: Levels of CK in plasma after exercise in the indicated groups of mice based on the legend shown in A. *P < 0.05 versus wild-type. Numbers below the graphs represent the number of animals studied. G: Uptake of Evan’s blue dye (red) in quadriceps of Scgd−/− and Scgd−/− Dysf-TG at rest and after exercise. Green corresponds to membrane/ECM staining with wheat germ agglutinin-fluorescein isothiocyanate. Scale bars = 100 μm.

