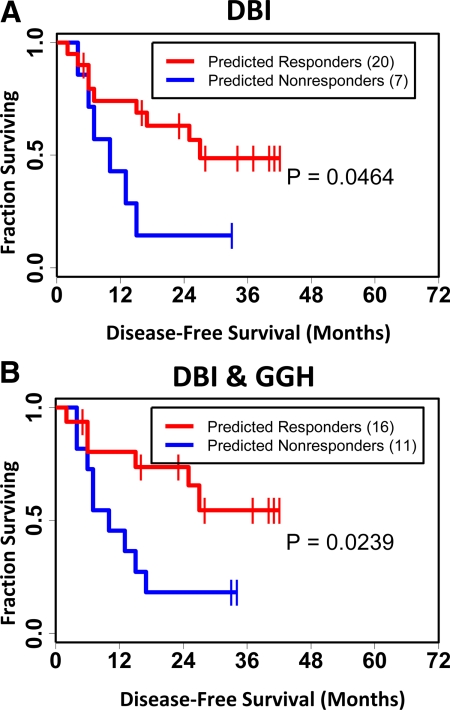
Figure 4.
Kaplan-Meier analysis of gene models as predictors of disease-free survival for 27 of the 45 patients in the MVAC study of Takata et al.6,7 The first 18 of the 45 patients6,7 were used to train their original 14-gene prediction model and thus were excluded from the current analysis. The gene-weighted voting technique as described by Golub et al18 was used to predict response to treatment for several different gene prediction models. Kaplan-Meier estimators for disease-free survival were generated for the respective gene prediction models: red curves describe predicted responders to treatment, blue curves describe predicted nonresponders to treatment. A: Gene-weighted voting technique applied for DBI alone. B: Gene-weighted voting technique applied for GGH and DBI in combination. P values were determined using the log-rank test and describe the statistical significance of stratification of disease-free survival based on predicted response.27

