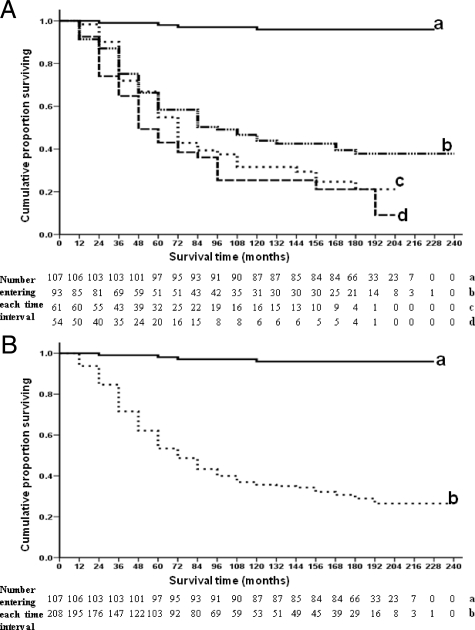
Figure 3.
Association of immunocytochemical staining by monoclonal antibody to AGR2 with overall survival of patients for different classes of immunocytochemical staining (A) and for using a cut-off of 1% between the two staining classes (B). A: The cumulative proportion of surviving patients as a fraction of the total for each year after presentation of patients with carcinoma cells classified as: a, −, completely negative staining (unbroken line; 100% = 107 patients); b, ±, borderline staining (broken line–dash dot dot dot dash; 100% = 93 patients); c, +, intermediate staining (dotted line; 100% = 61 patients); and d, ++/+++ moderate/strong staining (dashed line; 100% = 54 patients) for AGR2 is shown. There were 103 censored observations in a (19 dead of other causes); 39 in b (16 dead of other causes); 17 in c (10 dead of other causes); and 14 in d (13 dead of other causes). The cumulative proportions surviving ±1.96 SD to give ±95% CIs were (a) 0.97 ± 0.02, (b) 0.58 ± 0.05, (c) 0.43 ± 0.06, and (d) 0.39 ± 0.07 at 5 years; (a) 0.96 ± 0.02, (b) 0.42 ± 0.05, (c) 0.32 ± 0.06, and (d) 0.25 ± 0.07 at 10 years; (a) 0.96 ± 0.02, (b) 0.38 ± 0.05, (c) 0.21 ± 0.06, and (d) 0.09 ± 0.06 at 15 years; and (a) 0.96 ± 0.02, (b) 0.38 ± 0.05, (c) 0.21 ± 0.06, and (d) 0.0 ± 0.0 at 20 years. Overall, the four curves are highly significantly different (Wilcoxon statistic χ2 = 102.5, 3 d.f., P < 0.0001), and significantly different in the pairwise combination (a) with (b) (χ2 = 68.19, 1 d.f., P < 0.0001); but not (b) with (c) (χ2 = 1.081, 1 d.f., P = 0.094); or (c) with (d) (χ2 = 2.089, 1 d.f., P = 0.246). B: The cumulative proportion of surviving patients as a fraction of the total for each year after presentation for either a, patients with carcinomas classified as negatively staining (unbroken line) or b, positively staining (dotted line) for AGR2 is shown. For AGR2-negative carcinomas, 100% corresponds to 107 patients, and 100% for AGR2-positive carcinomas corresponds to 208 patients. There were 103 censored observations in a (19 dead of other causes) and 70 in b (39 dead of other causes). The cumulative proportions surviving ±1.96 SD to give ±95% CIs were (a) 0.97 ± 0.02 and (b) 0.49 ± 0.04 at 5 years; (a) 0.96 ± 0.02 and (b) 0.35 ± 0.03 at 10 years; (a) 0.96 ± 0.02 and (b) 0.26 ± 0.04 at 15 years; and (a) 0.96 ± 0.02 and (b) 0.26 ± 0.04 at 20 years. The two curves are highly significantly different (Wilcoxon statistic χ2 = 97.4, 1 d.f., P < 0001). In Cox’s univariate analysis RR = 30.5; 95% CI = 11.3 to 82.6.

