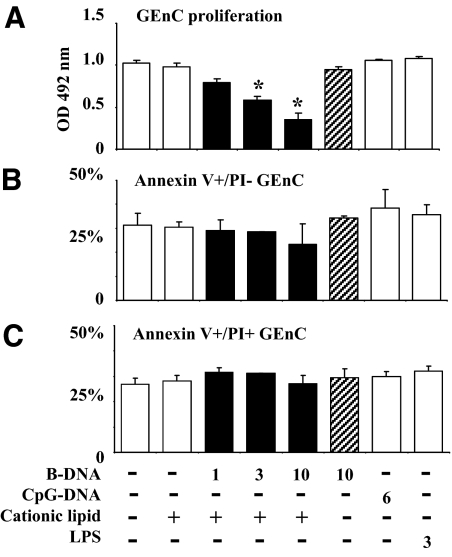
Figure 7.
GEnC proliferation and apoptosis. A: GEnC proliferation was determined in a period of 72 hours by bioluminescence assay as described in methods. Data represent mean OD ± SEM of three experiments measured at a wavelength of 492 nm. *P < 0.05 vs. medium. B and C: GEnC apoptosis was determined by flow cytometry. Data represent mean percentages of positive cells ± SEM of three experiments.

