Figure 4.
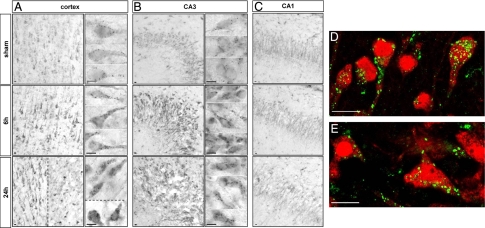
Effect of hypoxia-ischemia on cathepsin D expression and distribution. A–C: Immunohistochemistry after hypoxia-ischemia shows an increase in the cathepsin D-positive dots at 6 and 24 hours in the cortex (A) in the border of the lesion (left side of the dotted line) but also in some cells inside the lesion (right side of the dotted line and lower side in high magnification) and CA3 (B). High magnifications of two or more representative neurons are shown for the cortex and CA3, illustrating the substantial increase in the size of cathepsin D-positive vesicles from 6 hours after hypoxia-ischemia. C: No change is detectable in CA1. D and E: Confocal microscopy reveals that the cathepsin D increase occurs in neurons, as shown by double immunolabeling at 24 hours for NeuN (red) and cathepsin D (green) in cortex (D) and CA3 (E). Scale bars: 10 μm.

