Figure 5.
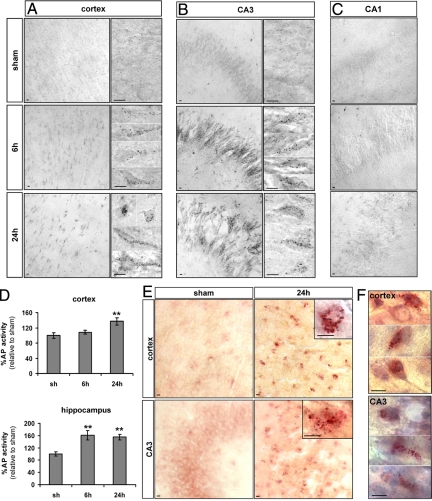
Effect of hypoxia-ischemia on lysosomal enzyme activities. A–C: Histochemistry for AP shows a strong increase in its activity (black dots) 6 and 24 hours after HI in the cortex (A) and CA3 (B). High magnifications of two or more representative neurons are shown for the cortex and the CA3, illustrating the strong increase of AP activity from 6 hours after hypoxia-ischemia. C: No change in AP activity is detectable in CA1. D: Enzyme assays confirm the increase in AP activity at 24 hours in the cortex and from 6 hours in the hippocampus. Data represents mean ± SEM. Comparisons with sham by t-test: ∗∗P < 0.01; n = 7. E: Histochemistry for AcHex shows a strong increase in its activity in the cortex and CA3 after hypoxia-ischemia and (F) the combination with a cresyl violet stain shows that the cells with increased AcHex activity at 24 hours are neurons with nonpyknotic nuclei as illustrated by three representative neurons. Scale bars: 10 μm.

