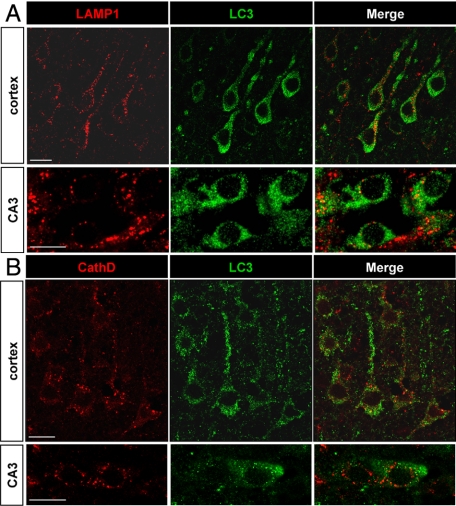
Figure 6.
Relationship between autophagosomes and lysosomes. A and B: The increase in punctate LC3 labeling (green) and in lysosomal markers (red) occurs in the same neurons, as is here demonstrated at 6 hours for LAMP1 (A) and at 24 hours for cathepsin D (B) in the cortex and CA3 with confocal microscopy. Scale bars: 10 μm.

