Figure 7.
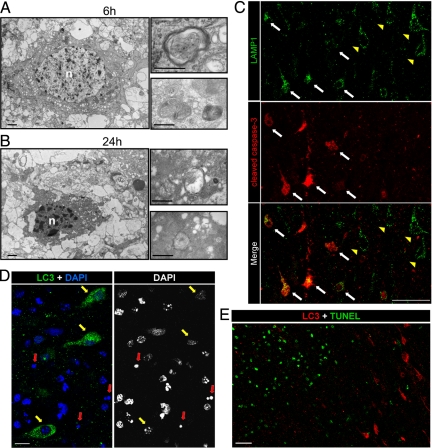
Relationship between autophagy and apoptosis in the cortex 24 hours after hypoxia-ischemia. A and B: Electron micrographs show neurons 6 hours (A) and 24 hours (B) after hypoxia-ischemia displaying numerous multimembrane vacuoles (putative autophagosomes) containing cytoplasmic material such as mitochondria, as illustrated at high magnification. Note the chromatin condensation in the nucleus (n) and the cytoplasmic shrinkage. Bars: 1 μm (left panels) and 0.5 μm (right panels). C: Double immunolabeling against LAMP1 (green) and cleaved caspase-3 (red) at 24 hours shows that the increase in LAMP1 is detectable in cortical neurons either positive (white arrows) or negative (yellow arrowheads) for cleaved caspase-3. Bars: 50 μm. D: Cortical neurons expressing strong punctate LC3 labeling at 24 hours after hypoxia-ischemia display little if any chromatin clumping (yellow arrows), and their nuclei are not pyknotic (red arrows) as demonstrated by co-labeling with 4′,6′-diamidino-2-phenylindole (DAPI) staining. Bars: 10 μm. E: These neurons were never TUNEL positive, as shown here for 24 hours. Scale bars: 50 μm.

