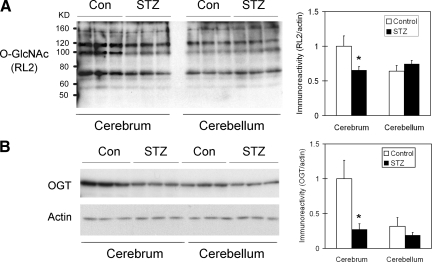
Figure 3.
Western blot analysis of protein O-GlcNAcylation and OGT in rat brain homogenates after STZ treatment. Homogenates of cerebrum or cerebellum from rats 21 days after i.c.v. injection of STZ or saline a control were analyzed by Western blots developed with monoclonal antibody RL2 against O-GlcNAc (A) or anti-OGT (B), as indicated at the left side of the blots. Actin blots were included as loading controls. Densitometric quantifications (mean ± SE) of all positive O-GlcNAcylated protein bands of the RL2 blot and of the OGT band of the OGT blot are shown at the right side of each blot. *P < 0.05 vs. controls.

