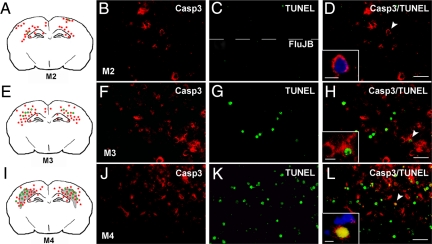
Figure 2.
Casp3 cleavage and DNA fragmentation in several models of carotid occlusion at 48 hours after injury. Spatial distribution (A, E, and I) of cleaved casp3 (red), TUNEL-positive (green) cells, and lesion area (gray) after uni-CCAo (model M2), bi-tCCAo (model M3) and bi-pCCAo (model M4), respectively. Note that images in mirror were detected in all three ischemic conditions. Double fluorescent staining in the CL cortex for cleaved casp3 (B, F, and J) and TUNEL (C, top, G, and K) or Fluorojade B (FluJB) labeling (C, bottom). After uni-CCAo, only cytosolic cleaved casp3 (enlarged image in D) without TUNEL or FluJB staining was observed. In contrast, several cells displayed cytosolic cleaved casp3 co-localized with TUNEL staining (F–H, note chromatin clumps typical of apoptotic cells, enlarged panel in H) after model M3. A large number of cells exhibited both cytosolic and nuclear cleaved casp3 and DNA fragmentation after model M4 (J–L). Some sections were counterstained with 4′,6′-diamidino-2-phenylindole (overlay in D and L). Scale bar represents 50 and 20 μm (enlarged panels).

