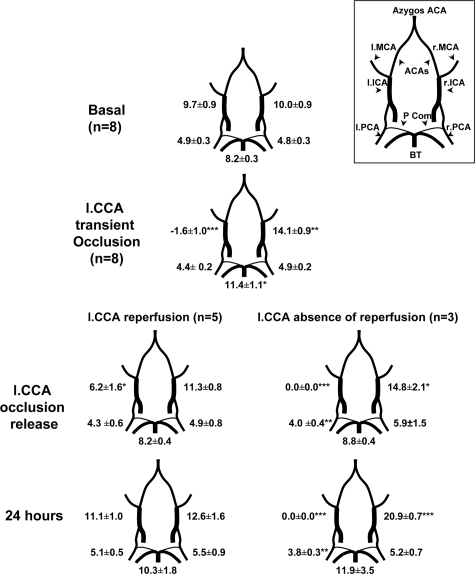
Figure 6.
CBF monitoring using two-dimensional color-coded ultrasound imaging. Time-average mBFV 1) before, 2) during occlusion of the left CCA and 3) after CCAo release in eight animals. mBFVs (mean ± SEM, cm · s−1) were measured in right (r) and left (l) posterior cerebral arteries (PCA, P2 segment) and internal carotid arteries (ICA), and in the basilar trunk (BT). During occlusion procedure, rat pups presented a reversed mBFV in the left ICA. After CCAo release, rat pups exhibited either reflow in the left ICA (n = 5) or not (n = 3). Data are mean ± SD *P < 0.05, **P < 0.01, ***P < 0.001 versus basal values. Upper right: Circle of Willis in the rat brain. ACA: anterior cerebral artery; Pcom, posterior communicants.

