Figure 1.
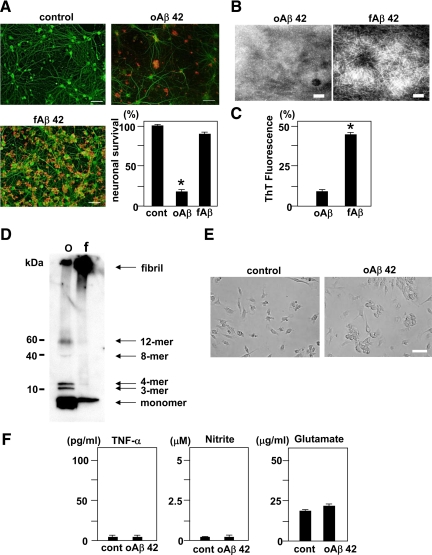
Neurotoxicity and morphologies of oAβ1-42 and fAβ1-42, and microglial response to oAβ1-42. A: The evaluation of neurotoxicity induced by oAβ1-42 and fAβ1-42. Neuronal cultures were treated with 5 μmol/L oAβ1-42 or fAβ1-42 for 24 hours. Neurons were stained with an anti-MAP-2 antibody (green). Aβ was stained with a mouse anti-amyloid β protein monoclonal antibody (4G8) (red). oAβ1-42 exhibited more striking neurotoxicity than fAβ1-42. Scale bar, 50 μm. Neuronal survival rate in oAβ1-42 treatment significantly decreased. ∗P < 0.05 as compared with the rate in control cultures. Each column indicates the mean ± SEM (n = 5). B: Images of oAβ1-42 (left) and fAβ1-42 (right) collected with an electron microscope. Scale bar, 100 nm. C: Thioflavin T assay for oAβ1-42 and fAβ1-42. ∗P < 0.05 as compared with the value of oAβ1-42. D: Western blot analysis of oAβ1-42 and fAβ1-42. oAβ1-42 (o) contained monomers, small oligomeric trimers (3-mer) and tetramers (4-mer), and the larger oligomers (octamers (8-mer) and dodecamers (12-mer)), whereas fAβ1-42 (f) contained monomers and fibrils. E: Microglial cultures were treated with or without 5 μmol/L oAβ1-42 for 24 hours. In a phase contrast, oAβ1-42 induced microglial adhesion. Scale bar, 50 μm. F: The measurement of TNF-α (left), nitrite (middle), and glutamate (right) produced by microglia activated with oAβ1-42. Microglial cultures were treated with 5 μmol/L oAβ1-42 for 24 hours. Each column indicates the mean ± SEM (n = 7).

