Figure 7.
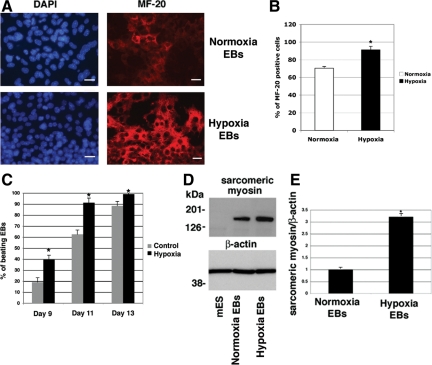
Hypoxia increases sarcomeric myosin expression in EBs. A: Immunofluorescence staining for sarcomeric-myosin using anti-MF-20 monoclonal antibody (red) of normoxia or hypoxia-stimulated EBs at 13 days of differentiation. Nuclear staining is shown in blue (4′,6′-diamidino-2-phenylindole). Scale bar = 20 μm. Magnification is ×40. B: Percentage of MF-20-positive cells/field. Values are averages of number of positive cells counted in several fields (between 5 and 8). ∗P < 0.05. C: Percentage of beating EBs counted from days 9 to 13 of differentiation. For each time point the number of EBs counted were between 35 and 50. Data are representative of three experiments. D: Western blot analysis for sarcomeric-myosin in normoxia or hypoxia stimulated EBs at day 13 of differentiation using the MF-20 antibody. Membranes were reprobed with an anti-β-actin antibody and densitometrically analyzed (E) by normalization of sarcomeric-myosin levels to β-actin content. Densitometric analysis is representative of two Western blot experiments. ∗P < 0.05.

