Figure 7.
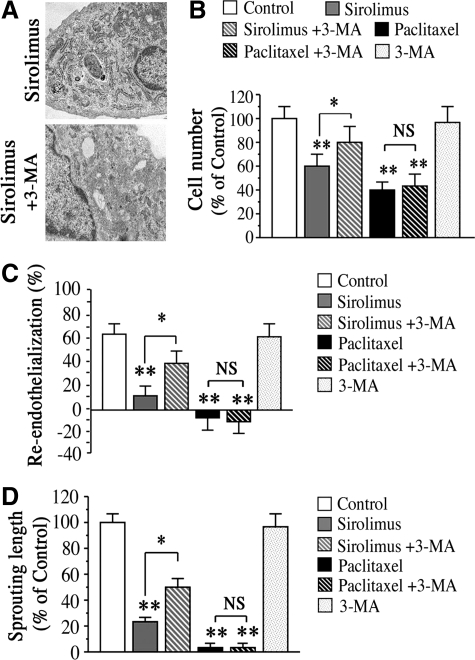
Effects of autophagy inhibition on sirolimus- or paclitaxel-induced impairment of re-endothelialization and revascularization. A: EM of HAECs treated with sirolimus alone (upper panel) or ECs treated with both sirolimus (10 nmol/L) and 3-MA (1 mmol/L) (lower panel). B: HAECs cell number in the presence of sirolimus (10 nmol/L), paclitaxel (10 nmol/L) or 3-MA (1 mmol/L). n = 6 per group. **P < 0.01 vs. control group without treatment. *P < 0.05 vs. group with sirolimus. C: Inhibition of endothelial autophagy by 3-MA (1 mmol/L) attenuated sirolimus-induced impairment of re-endothelialization on day 7, whereas no attenuation of paclitaxel-induced impairment was observed. Values of % re-endothelialization below zero indicate damage of unscratched endothelium. n = 8 per group. **P < 0.01 vs. control group. *P < 0.05 vs. group with sirolimus. NS means no significant difference between two groups. D: Treatment with 3-MA attenuates sirolimus-induced impairment of aortic revascularization on day 4, while no attenuation of paclitaxel-induced impairment was observed. Values are expressed as mean ± SEM. n = 8 per group. **P < 0.01 vs. control. #P < 0.05 vs. sirolimus alone.

