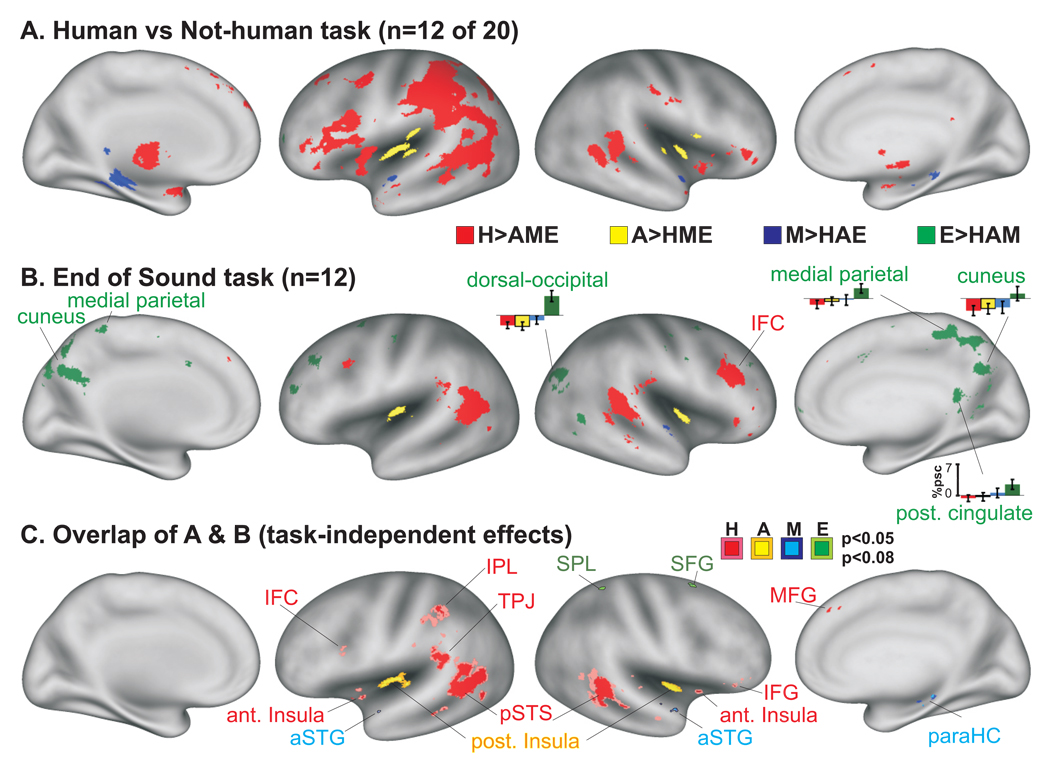
Figure 4.
Group-averaged activation comparisons for sound categorization using different listening tasks. (A) Data from 12 of the 20 participants illustrated in Fig. 2, judging each sound as being produced by a human or not. (B) Data from 12 naïve participants for Experiment #2 performing a category-non-specific task. Several histograms for the E>HAM condition are illustrated (%psc=percent signal change relative to silent events). Data in panels A and B are both at p<0.05, α<05 corrected. (C) Common four-fold differential activation patterns across the two groups (p<0.05 and p<0.08, uncorrected) revealing task independent effects. Some colored foci were outlined for clarity.

