Figure 1.
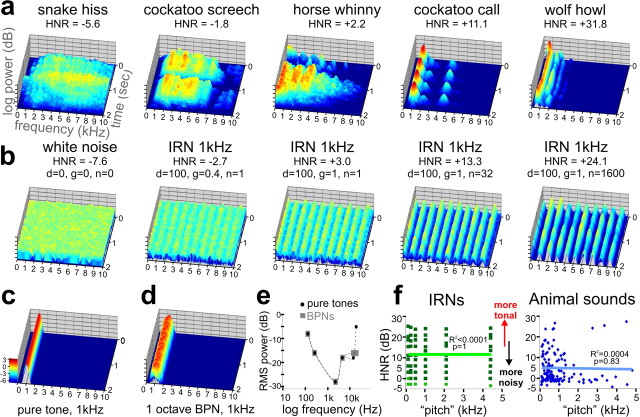
Sound stimulus attributes. a, Three-dimensional spectrograms of five vocalizations (2 s duration), including one from a snake, two from birds, and two from mammals. In all plots, the frequency was limited to 10,000 Hz for illustration purposes, and the z-axis represents log-power (relative intensity, scale in c in log exponentials). The HNR value for each sound is indicated. b, Spectrograms of IRNs derived from one white noise sample (leftmost panel). The IRNs with greater HNR value correlate with more prominent frequency bands (peaks) at all harmonics (1 kHz in these examples) and had a more tonal quality. c, d, Spectrograms of an example PT (c) and an example BPN (d) used for the FDRR/tonotopy localizer scans. Note the similarity of these peaks to those of the IRNs. e, Audiometric profile used to match perceived loudness of PT and BPN stimuli for the FDRR localizer scans. f, Charts comparing “estimated pitch” versus HNR value of IRNs and animal vocalizations. Light green dots depict IRNs for which a pitch could not be accurately estimated computationally, although was determined by the IRN delay. There was no significant linear correlation between the pitch and HNR value for either stimulus set.

