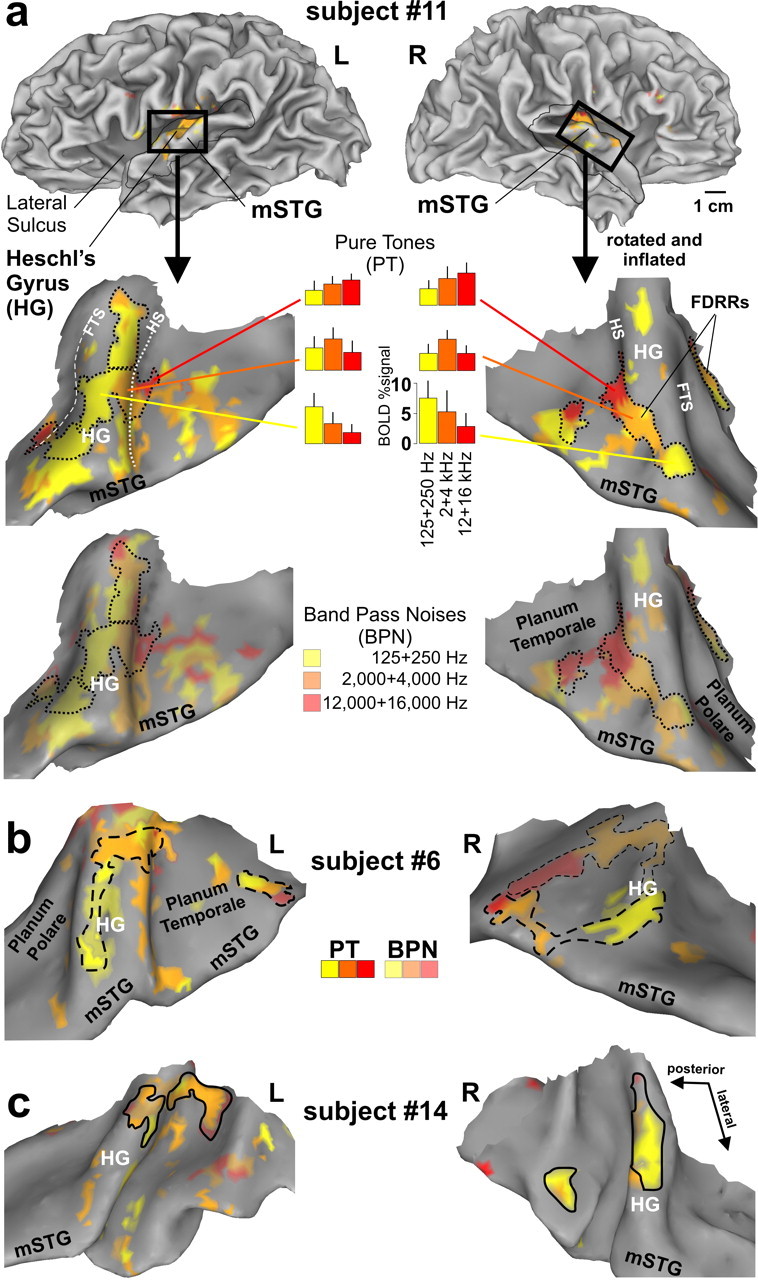
Figure 2.

Functional localization of FDRRs in auditory cortex of three participants (a–c). Cortical hemisphere models of one participant (top) illustrate typical “cuts” (thin black outlines and black boxes) made to optimally view auditory cortex along the superior temporal plane and mSTG in this and subsequent figures. The cortical models of each hemisphere were slightly inflated and smoothed to facilitate viewing of Heschl's complex, including HG, Heschl's sulcus (HS) (white-dotted line), and the first transverse sulcus (FTS) (white-dashed line). The fainter dashed outline in b (right) depicts a prominent FDRR defined by the BPNs. The dotted, dashed, and solid black FDRR outlines distinguish these three representative individuals in this and subsequent figures. Refer to text for FDRR outlining criteria.
