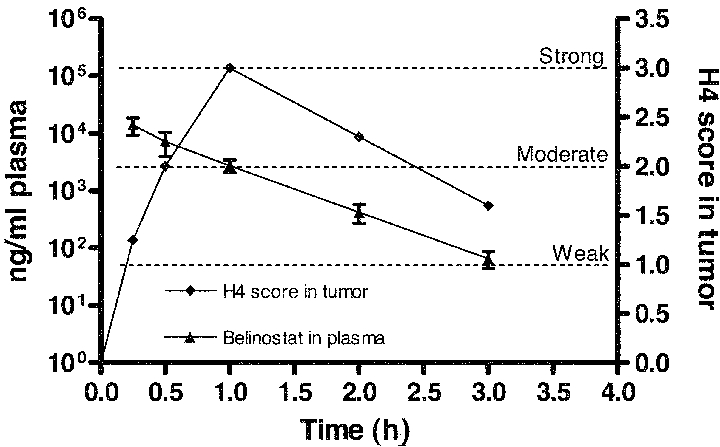
Fig. 8.

Overlay plot of belinostat concentrations in plasma and H4 acetylation score in tumor tissue after treatment with belinostat, 200 mg/kg i.v. Maximal acetylation is observed 1 h after treatment, which coincides with belinostat plasma concentrations above 103 ng/ml. A2780 xenograft, NMRI nude mice, 3–4 mice/time point.
