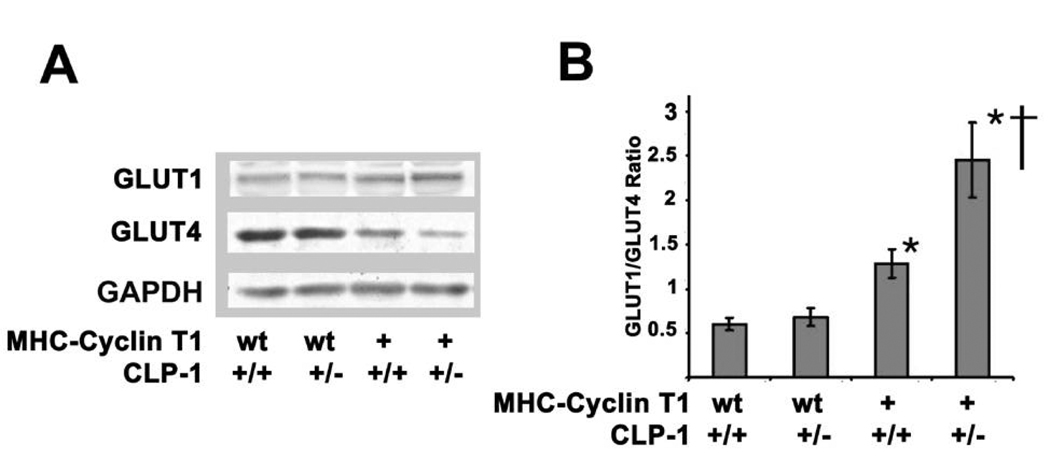
Figure 4.
Glucose transporters GLUT1/GLUT4 ratio in MHC-Cyclin T1/CLP-1+/− mice. A, Western blot shows expression levels of GLUT1, GLUT4, and GAPDH in heart lysates of the indicated genotypes. B, quantification of GLUT1/GLUT4 ratio. Data are expressed as mean ± SE of five independent experiments of three-month old mice. *P < 0.05 versus control; †P < 0.05 versus MHC-Cyclin T1.

