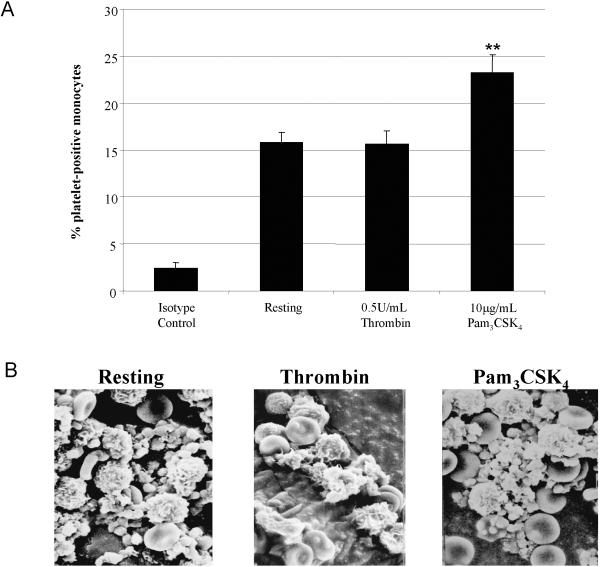
Figure 9. Differential interactions of platelets with monocytes upon stimulation with thrombin or Pam3CSK4 using SEM.
Bar graph (A) shows the percent of platelet-positive monocytes determined through flow cytometry of whole blood samples untreated (Resting) or treated with 0.5 U/mL thrombin or 10 μg/mL Pam3CSK4 for 10 minutes at room temperature. The average percent and standard error from 7 experiments are graphed. ** p<0.01 compared to Resting and Thrombin treatments using an ANOVA analysis, followed by a Bonferroni post test. Scanning electron micrographs (B) of control (no agonist) and samples treated with 0.5 U/mL thrombin or with 10μg/mL Pam3CSK4. Magnification at 15,000X.

