
Figure 4.
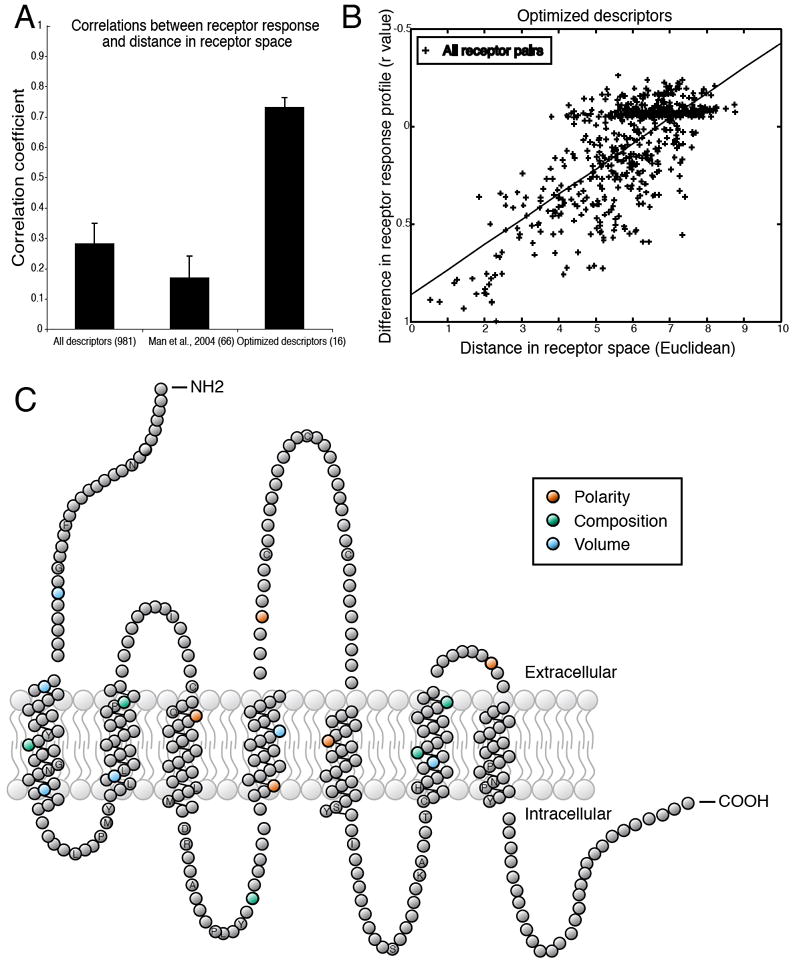
Distance in receptor space predicts similarity in responses to odorants. (A) Testing various receptor-similarity metrics against the functional data shows that our optimized descriptors predict functional responses better than full-sequence similarity or similarity at previously suggested residues (34). (B) Differences in the odorant response profiles of two receptors are correlated with distances between the same receptors, calculated using 16 optimized descriptors (r = 0.73, p < 0.001). Each point represents one pair of receptors. The absence of any completely non-correlated receptor pairs is due to the fact that all pairs of receptors have at least one odorant in common which fails to activate both receptors. (C) Snake plot of a typical OR in which amino acid residues with ligand-specificity-determining properties are highlighted. Residue properties selected by the greedy optimization algorithm are indicated by color. Amino acid positions conserved in at least 90% of the 1425 receptors are labeled with their single-letter amino acid code. Abbreviations for the amino acid residues are as follows: A, Ala; C, Cys; D, Asp; F, Phe; G, Gly; H, His; I, Ile; K, Lys; L, Leu; M, Met; N, Asn; P, Pro; Q, Gln; R, Arg; S, Ser; T, Thr; and Y, Tyr.