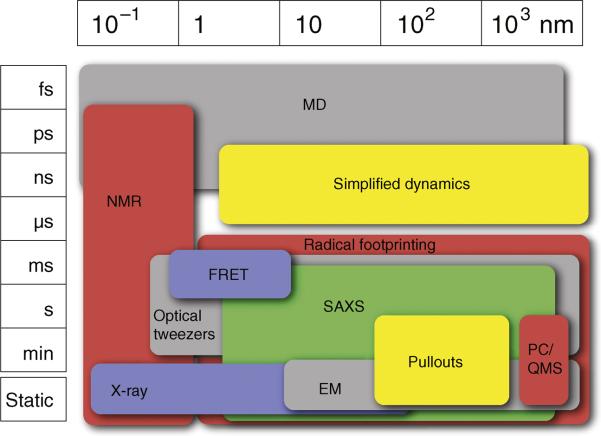
Figure 3. An overview of the spatial and temporal coverage of the various methods.
The x-axis represents the size of the systems that can be explored by each method in nanometers. The y-axis represents the time scales that can be reached. The methods and abbreviations are described in Table 2.

