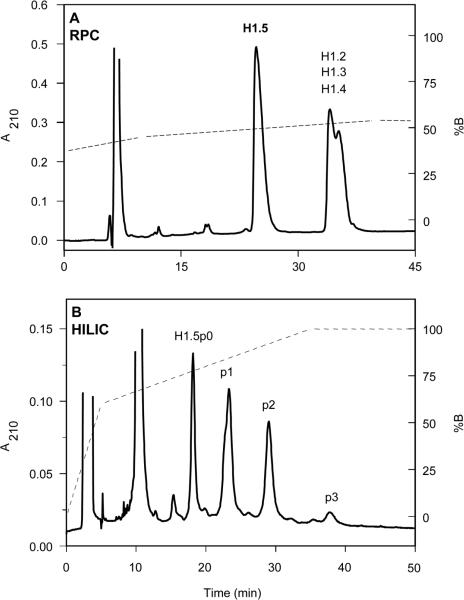
Figure 18.
HILIC/CEX separation of phosphorylated H1 histones. Columns: (A) RPC, same as Fig. 17; (B) HILIC/CEX (denoted HILIC in Fig. 18), PolyCAT A weak cation-exchange column (200 × 4.6 mm id, 5 μm particle size, 300 Å pore size). Conditions: (A) RPC, linear AB gradient at a flow-rate of 1.5 mL/min, starting at 47% B and increasing to 55% B in 35 min, where eluent A is 0.1% aq. TFA and eluent B is 0.1% TFA in 70% v/v ACN; (B) HILIC/CEX, two-step gradient, at a flow-rate of 1 L/min, starting from 0% B and increasing linearly to 60% B in 5 min and to 100% B in 30 min, where eluent A is 10 mM TEA-methanephosphonic acid (MPA), pH 3, and eluent B is eluent A containing 1000 mM NaClO4, both eluents also containing 70% v/v ACN; the gradients for both the RPC and HILIC/CEX runs are denoted by the dotted lines on the elution profiles; the histone H1.5 fraction isolated by RPC (A) was subsequently applied to HILIC/CEX (B); histone peaks H1.5p0, p1, p2 and p3 denote nonphosphorylated, monophosphorylated, diphosphorylated and triphosphorylated histone H1.5, respectively. Adapted from ref. [49] with permission from Elsevier.

