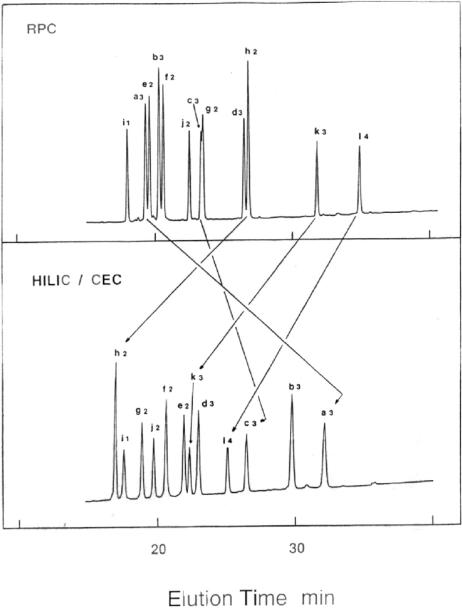
Figure 5.
Selectivity variations of RPC versus HILIC/CEX. Columns: RPC, same as Fig. 3, except for 250 Å pore size; HILIC/CEX (denoted HILIC/CEC in Fig. 5), same as Fig. 3. Conditions: RPC, linear AB gradient (2% B/min, equivalent to 1% ACN/min at a flow-rate of 1 mL/min where eluent A is 10 mM aq. (NH4)2HPO4, pH 7, and eluent B is A containing 50% v/v ACN, both eluents also containing 200 mM NaClO4; HILIC/CEX same as Fig. 4D; runs carried out at 30°C and peaks detected by absorbance at 210 nm. Peptide sequences: same as Fig. 4. The numbers in the peptide denotations represent the net positive charge on the peptides. Arrows denote major selectivity changes between the two HPLC modes.

