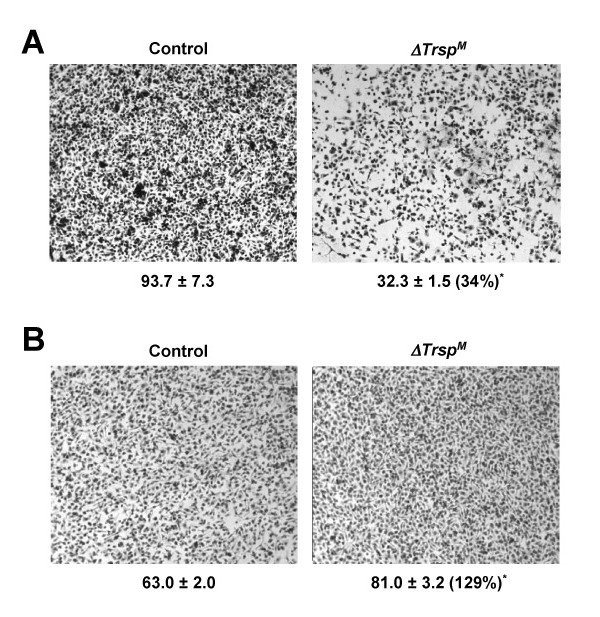
Figure 6.

Reduced invasion of ΔTrspM macrophages in a protein gel matrix. (A) Migration of BMDMs was analyzed by a transwell assay with a protein gel matrix (Matrigel) layer in the upper chamber. The number below each of the panels indicates relative macrophage migration and represents mean ± standard deviation (n = 3). *, p = 0.0003. The number in parenthesis indicates percentage of cell migration in the ΔTrspM sample relative to the control sample. (B) Macrophage migration was analyzed by a transwell assay and the data presented as in A. but in the absence of a Matrigel layer. *, p = 0.0002.
