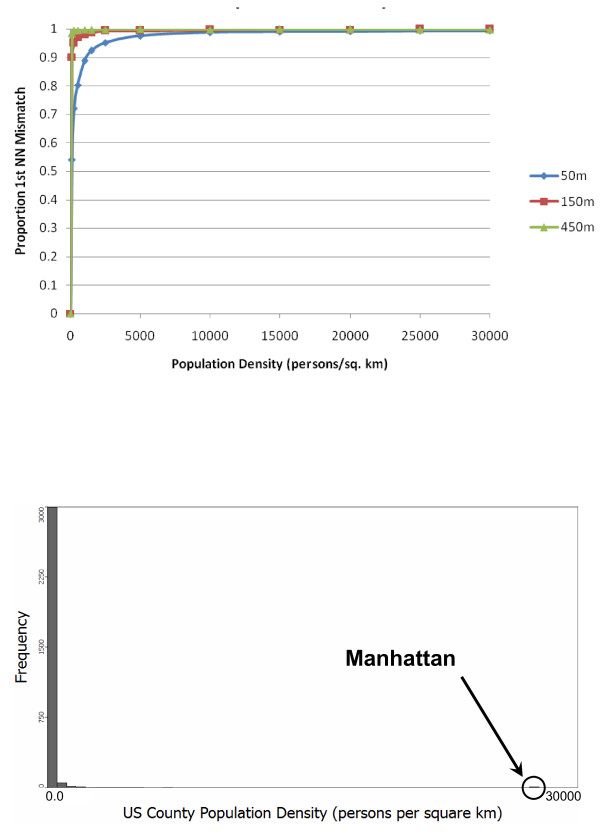
Figure 4.
Global perturbability (proportion of first nearest neighbor mismatch) versus population density (top) and the population density histogram for US counties (bottom). All simulations used a population of 500 individuals at the recorded densities. The different lines represent different mean geocoding error distances. The reported values represent a mean from 10 randomizations for each geocoding error/density combination.

