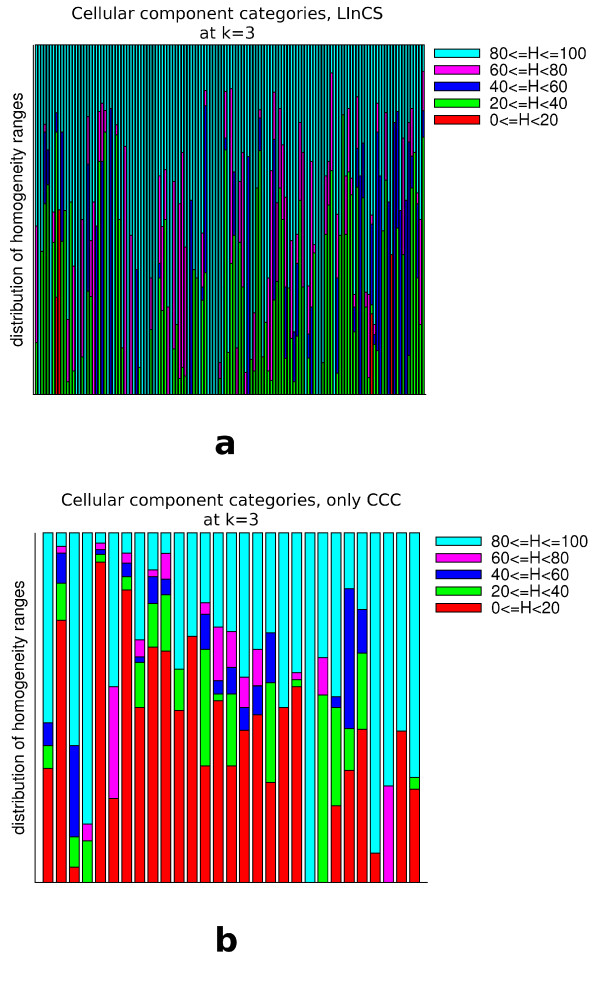
Figure 16.
Shown are for all clusters at level 3 of the CCC the homogeneity value distribution of those cellular component categories that are assigned to at least one protein in the cluster. The upper diagram shows the distributions of those clusters that are included in the LInCS clustering and the lower one those of the clusters that were not included.

