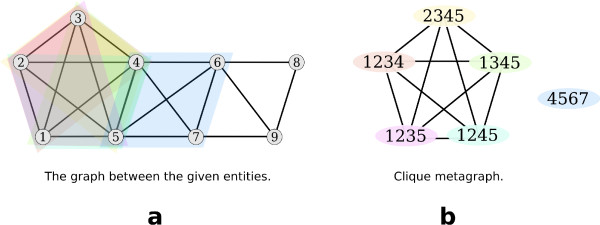
Figure 5.
(a) In the entity-relationship graph the differently colored shapes indicate the different maximal cliques of size 4. (b) In the clique metagraph every clique is presented by one node and two nodes are connected if the corresponding cliques share at least 3 nodes. Note that nodes 4 and 5 end up in two different node clusters.

