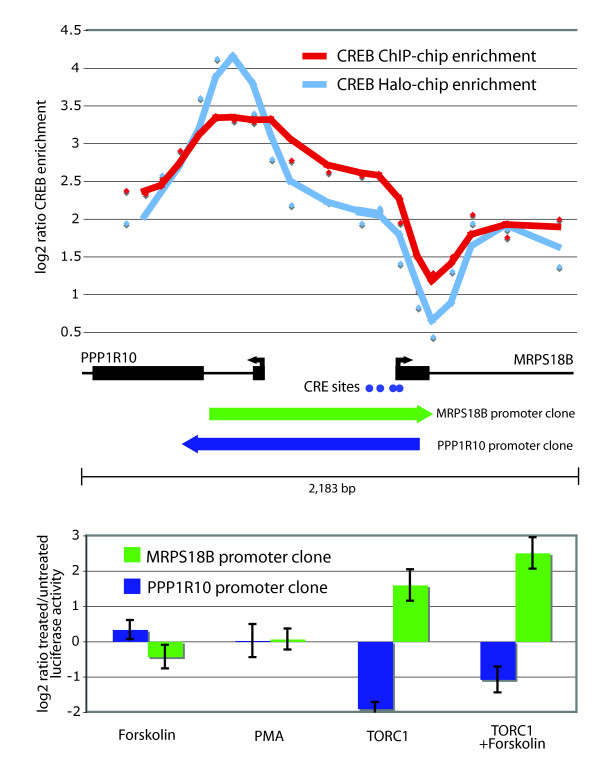
Figure 6.
CREB binding and promoter activity at a bidirectional promoter showing opposite induction patterns in the presence of TORC1. A. CREB binding to PPP1R10/MRPS18B bidirectional promoter. Identical to Figure 4, the log2 ratio for each probe spanning this bidirectional promoter was determined for the CREB ChIP-chip (plotted in red) or HaloCHIP-chip (plotted in blue) data. Spacing between probes is approximately 131 bp. Positions of transcription start sites (TSS) are shown with arrows indicating the direction of transcription with lengths of exons in blocks and introns drawn as lines. Positions of full CRE sites are indicated below by blue dots. Also shown is the region of each cloned promoter fragments, indicated by the green and blue arrows, used in the luciferase assay shown below in panel B. The arrows indicate the direction in which the cloned fragments were tested in the luciferase assay. B. The log2 ratio of treated/untreated luciferase activity is plotted for each promoter fragment in each condition indicated. The MRPS18B promoter (in green) shows significant inducible activity in the presence of TORC1 with and without FSK, while the PPP1R10 promoter (in blue) shows significant repression in the presence of TORC1 with and without FSK.

