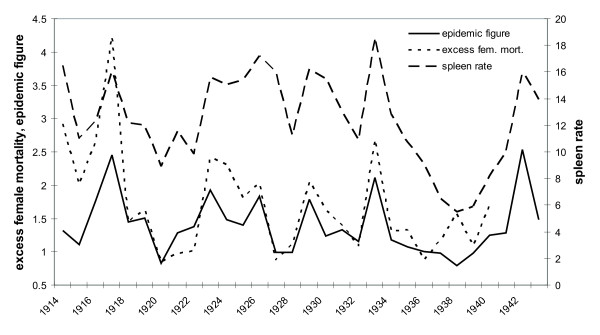
Figure 1.
Spleen rate, Epidemic Figure (EF), and relative female mortality of all age groups between 1914 and 1943 for all districts in the Punjab. Relative female mortality (as % × 10, dotted line), defined as the ratio of female to male mortalities, correlates well with both malaria indices spleen rate (dashed line) and Epidemic Figure (solid line). The values of the EF and relative female mortality for 1918, during the influenza epidemic, were estimated, based on the linear regression results with the spleen rate (r = 0.76 and r = 0.64 respectively).

