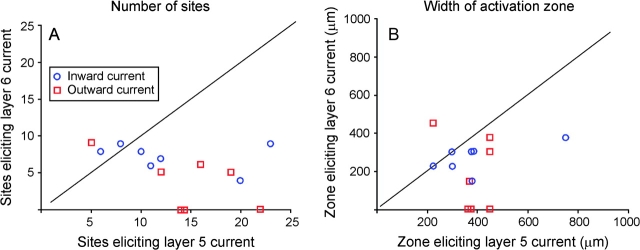
Figure 9.
A) Scatterplot showing the relationship between the number of photostimulation sites from a 14 × 14 grid eliciting a significant inward (blue circle) or outward (red square) current for layer 5 and layer 6 corticothalamic neurons from the same cortical column. (B) Scatterplot showing the relationship between the horizontal width of the region eliciting a significant inward (blue circle) or outward (red square) current for layer 5 and layer 6 corticothalamic neurons from the same cortical column. In each case, the diagonal line represents unity slope or an equivalent number of sites (A) or width of activation zone (B) eliciting a response in intracolumnar layer 5 and layer 6 corticothalamic neurons.

