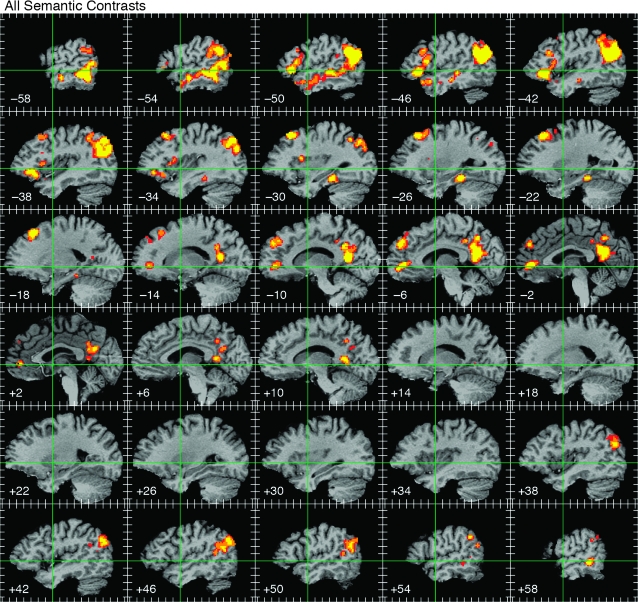
Figure 3.
ALE map of all semantic foci, thresholded at whole-brain corrected P < 0.05. Activations are displayed on serial sagittal sections through the stereotaxic space of Talairach and Tournoux (1988) at 4-mm intervals, with slice locations given at the lower left of each image. Green lines indicate the stereotaxic y and z axes. Tick marks indicate 10-mm intervals. The color scale indicates voxelwise probability values of P < 0.01 (red), P < 0.001 (orange), and P < 0.0001 (yellow).

