Figure 3.
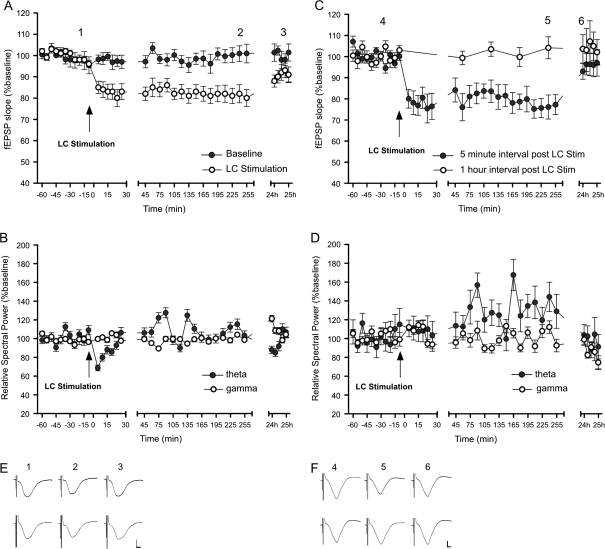
LC stimulation induces LTD at SC–CA1 synapses. LC burst stimulation (100 Hz) coupled with test pulse stimulation of SC–CA1 synapses induces CA1 LTD that lasts for over 4 h. No depression occurs in the baseline group that did not receive LC stimulation. (B) Induction of LTD is accompanied by a reduction in the spectral power of theta-frequency network oscillations lasting 15 min. The spectral power of gamma frequency oscillations is unaffected. (C) LC stimulation–induced CA1 LTD requires activation of the SC–CA1 pathway following LC stimulation. Application of SC test pulses at 1-h intervals after LC stimulation does not induce LTD. (D) Without regular SC test pulse stimulation after LC stimulation, there is no observable suppression of theta oscillations. (A, C, insets) Analog traces representing SC–CA1 field potentials before LC stimulation, 4 h and 24 h after LC stimulation. (E) Top row: no LC stimulation baseline group. Bottom row: LC stimulation group. (F) Top row: group with 5-min SC test pulse intervals after LC stimulation. Bottom row: group with 1 h SC test pulse intervals after LC stimulation. Calibration: vertical bar, 1 mV; horizontal bar, 3 ms. The mean EPSP slope is shown along with the corresponding SEM.

