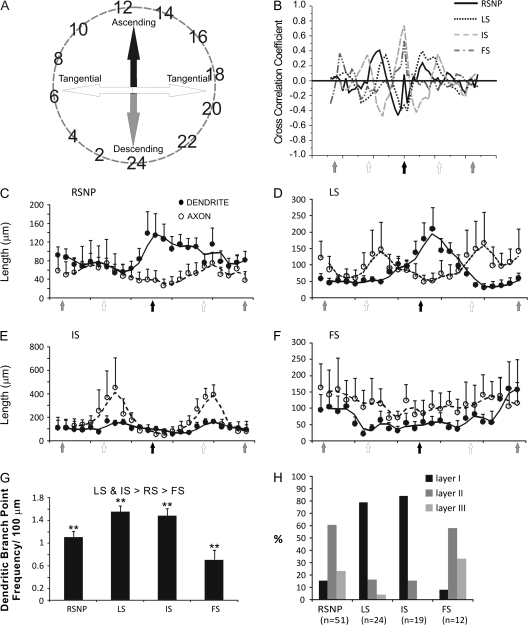
Figure 5.
Interneuron axon and dendritic projection trajectory analysis. This figure was derived from the axonal and dendritic polar histogram data from cells of the 4 firing types that were morphologically reconstructed. Data, which, originally appeared in a circular fashion (A, see Materials and methods) were converted to 2 column data sets with the angular value representing the “X” axis and axonal (or dendritic) length representing the “Y” axis. The data from same group of interneurons were then averaged and analyzed. Open circles represent axons, and closed circles represent dendrites. The cell types include: RSNP (C), LS (D), IS (E), and FS cells (F). The CCC for each of the 4 firing types (B) indicates that the greater the CCC value for a given direction the greater the overlap between axons and dendrites for that direction. Note that dendrites and axons of IS cells (gray dashed line) had the largest CCC value toward the pial surface (black arrow in X axis), indicating that their axons and dendrites overlap the most when ascending, but the longest projections (but with less overlap) for both axons and dendrites occur tangentially (E). A bar graph indicates the average dendritic node frequency for each of the 4 firing types (G). Firing types were also segregated by their percentage per laminar location (H). **P < 0.01.

