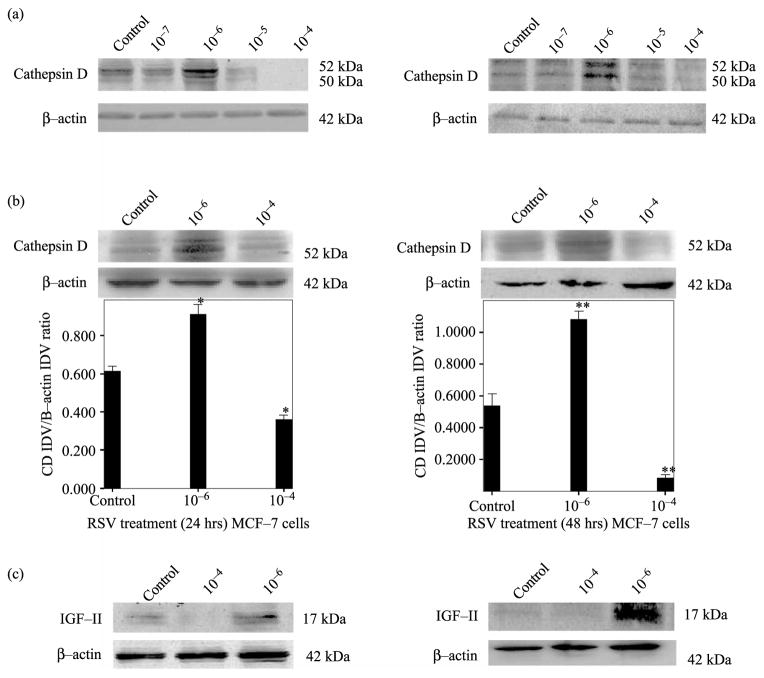
Figure 1.
RSV concentration-dependent effect on CD secretion by MCF-7 cells after 24 and 48 h treatment. Panel a shows a WB of CD secreted by MCF-7 cells, treated with different RSV concentrations (10−7–10−4). Panel b shows a representative WB of CD secreted by cells treated with RSV (10−6 M) or (10−4 M) dose of three separate experiments (upper panel). Lower panel b shows bar graph representations of CD data normalized to β-actin and presented as the mean ± standard error of three separate experiments. Asterisks indicate values significantly different from controls (*p < 0.05, **p < 0.01). Panel c shows WB analysis of IGF-II at 24 and 48 h of RSV treatment (10−6 and 10 −4 M).

