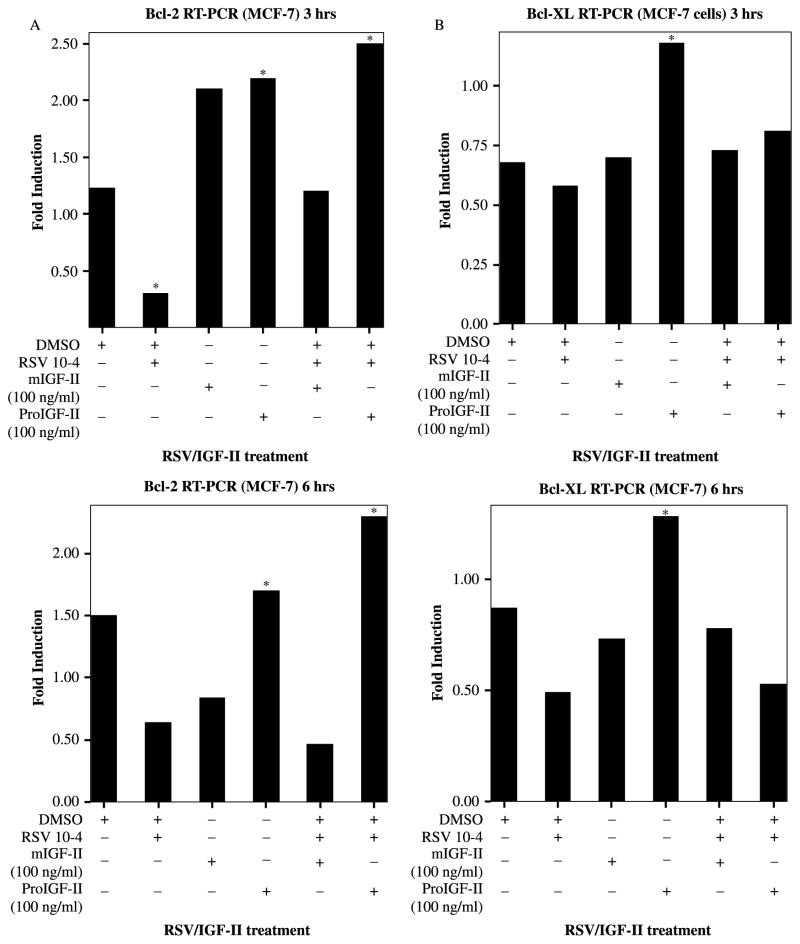
Figure 2.
RSV (10−4 M) and/or IGF-II (mature and precursor forms, 100 ng/ml) effect on survivin gene expression in MCF-7 cells and assessed by Real Time-PCR (RT-PCR). Panels (A)–(B) represent Bcl-2 and Bcl-XL gene expression, expressed as fold increase/decrease relative to corresponding control groups 3 and 6 h post-treatment. GAPDH was used as internal control. ★ indicate values significantly different from vehicle or RSV-treated cells (★p < 0.05).

