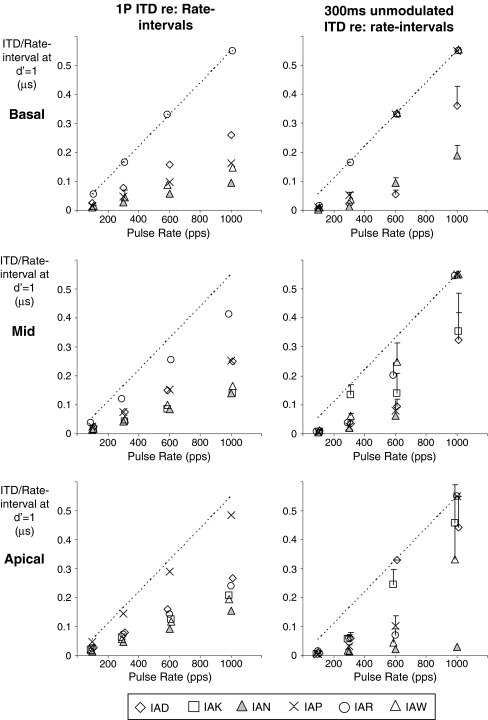
FIG. 4.
ITD threshold data from Figure 1 replotted as a fraction of the interpulse interval for rates between 100 and 1,000 pps. Thresholds for single-pulse stimuli are shown in the left column and for 300-ms unmodulated bursts in the right column. The top, middle, and apical rows in each column again show results for basal, mid, and apical electrode pairs, respectively, and individual subject data are shown by the different symbols. Unmeasurable thresholds or those in excess of 1 ms that reflect an inability to discriminate left from right ear delays when cues in each ear were 500 μs or more are shown along the dashed diagonal line representing a threshold of 1100 μs.

