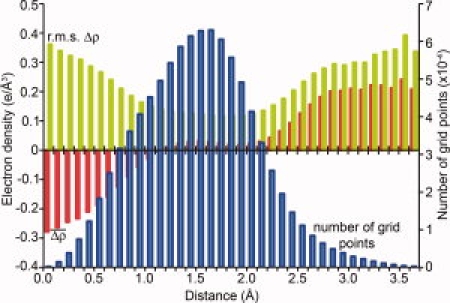
Figure 1.

Average and root-mean-square values of the difference electron density for plectasin plotted as a function of the distance from the nearest atom in the model. The difference map (Δρ) has coefficients (Fo−Fc), phases from the refined model of plectasin (PDB code 3E7R), and was calculated on a 0.1 Å grid. For each grid point, a search was made for the nearest atom in the model, including ordered solvent. The density values were binned according to the distance to the nearest atom and the average (red) and rms (green) values plotted in the figure. The histogram also shows the number of grid points in each bin (blue). The plot shown is for the difference density map calculated at 1.5 Å resolution. This is not the outer limit of the data but was used because the X-ray observations are very complete and most of the phases should be correct. Maps at higher resolution give fairly similar histograms as do SigmaA-weighted Fo−Fc maps (not shown).
