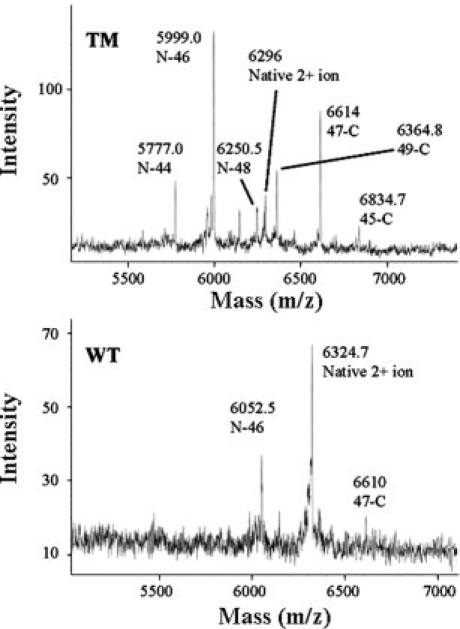
Figure 3.

Initial proteinase K cleavage sites for WT iso-1-cytc and the TM variant. MALDI-TOF mass spectra are performed after digestion with proteinase K at a 1:500 protease:protein ratio for 1 min at 0°C. The major peaks are labeled N-X or Y-C, where N-X corresponds to a fragment from the N-terminus to sequence position X and Y-C corresponds to a fragment from sequence position Y to the C-terminus. For the major cleavage site between Tyr 46 and Ser 47, the expected masses are given in the text. For other fragments observed for the TM variant, the expected masses are: N-44, 5780.4; N-48, 6250.9; 49-C, 6365.3, 45-C, 6835.8 m/z. The unmarked peak just below N-48 is attributable to 51-C (expected, 6149.1 m/z) and the small unmarked peak at <6500 m/z is attributable to N-50 (expected, 6467.1 m/z).
