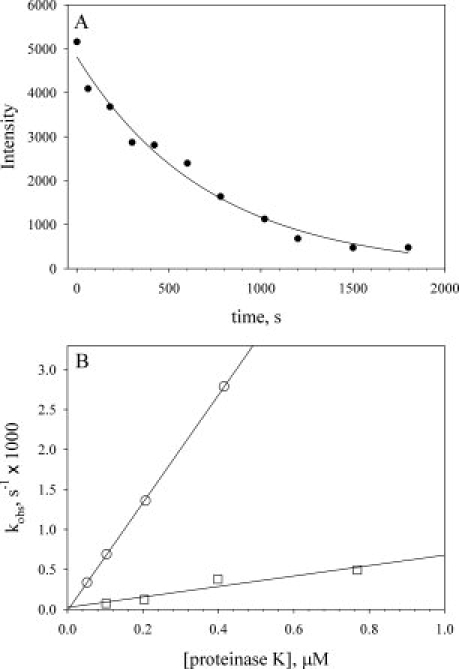
Figure 4.

Kinetics of limited proteolysis by proteinase K from SDS-PAGE data for WT iso-1-cytc and the TM variant. A: Determination of kobs from SDS-PAGE data for the intensity of the native uncut band as a function of time (Supporting Information Figure 4). Data were collected at room temperature with a TM variant concentration of 0.5 mM and a proteinase K concentration of 200 nM. The solid curve is a fit of the data to a single exponential decay function. B: kobs versus proteinase K concentration for the TM (○) and WT (□) iso-1-cytochromes c at 22 ± 1°C. The solid curves are linear fits to the data yielding slope = K′op × (kcat/KM).
